
WeatherGlobe is a web-based visualisation tool for meteorological data. It uses modern web technologies, accesses various interfaces at data suppliers and can be configured flexibly.
We provide current weather globe output with various examples:
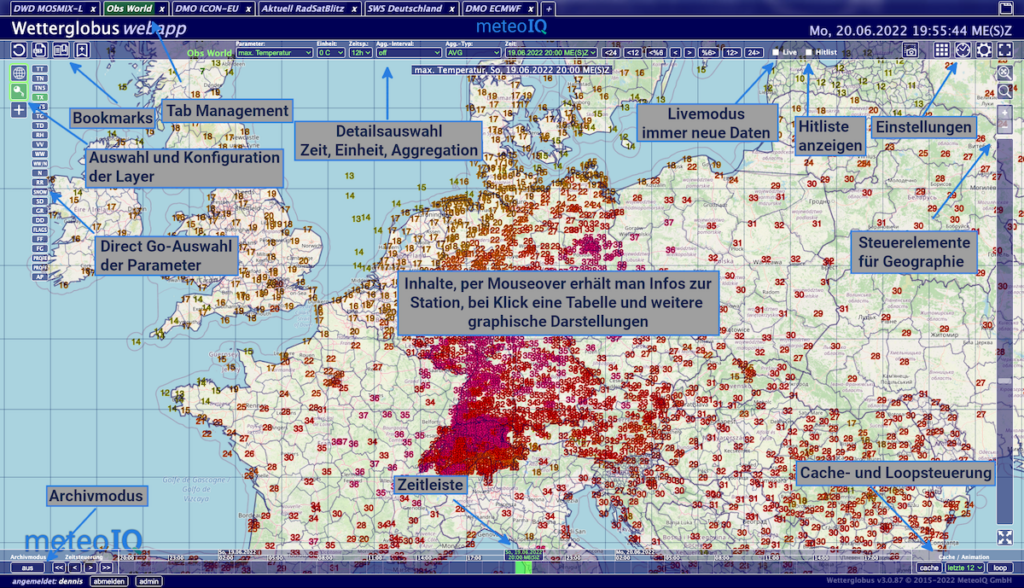
Description of the basic control elements of WeatherGlobe using the example of a view with weather observation data
Point data such as station observations as well as surface data, i.e. radar and satellite images or the results of weather model calculations, can be visualised in the WeatherGlobe. Depending on the selected data type, there are different ways of interacting with the data:
Map navigation
- The background map is true to projection and scale and the user can navigate it intuitively using familiar techniques (moving the map, zooming in or out, marking a map area and zooming in).
- The map is not distorted, but always displayed correctly in the appropriate geographical projection.
- Various visualisations are possible for the background map. A neutral, single-colour background is possible, physical terrain heights can be displayed or a topographical map with traffic routes, settlement areas, land use, bodies of water (Open Streetmap) can be displayed in the background.
- State and federal state borders, built-up areas, city names and rivers can also be superimposed on the map.
Time control
- WeatherGlobe has comprehensive time control. There is both a timeline and the option to directly select a time or forecast time step. There are also buttons to jump directly forwards or backwards to the next full 3, 6 and 12-hour time.
- Time steps can be “cached” in the timeline (i.e. loaded in the background so that they are displayed quickly when selected). It is also possible to run a loop over time steps.
- When switching between different data records, the selected time is retained – as far as this makes sense.
- Historical data records can be displayed using the archive function. A date can then be entered directly and the data for that day visualised.
- If the “live mode” is activated, the display is updated as soon as new data arrives (useful for central monitors, for example, which constantly show the latest radar images).
- Whether UTC or local time is used can be set by the user.
Parameter selection
- Different parameters can be selected within a data set. If a parameter such as precipitation or wind gusts covers different reference periods, these can also be selected.
- The measurement unit can be changed for various parameters.
Data interaction
- Metadata (e.g. station name and operator) can be visualised via mouseover or grid point values can be determined for model fields.
- By clicking on a weather station, the measured values of the last 24 hours are displayed in table form. Other display formats can also be selected here, for example as a graph with a year-long history.
- The hit list display shows the highest or lowest measured values on the map; it is also possible to filter by federal state.
Enable efficient workflows
- User-based default settings can be saved, for example which map view is to be used, which parameter is shown when a data record is called up and which time zone is used.
- Map views and a specific data selection can be saved as bookmarks. This means that a specific map section with observation or model data can be defined and saved as a user-based bookmark. If the bookmark is then called up again the next day, for example, the same map section is displayed with the latest data.
- Each user can create and process screenshots themselves. It is also possible to produce time-controlled graphics with Wetterglobus. This option can be explained to administrators.
WeatherGlobe is continuously being developed. The requirements and wishes of our customers are taken into account.